 Some things are better left unseen.
Like how haggis is made.
Or Troll 2.
Or... an exhaustive snapshot of your Internet usage.
But if you dare, now there’s Surfkollen, a new website that takes your Internet activity and breaks it down for you in potentially horrifying charts and graphs, online now.
This was made by the Swedes. That’s why there’s a funny-sounding word after “Surf.”
Anyway, visit the page and download a plugin so it can analyze your online history from the past seven days. Don’t worry, it’ll never save your data or publish the searches. Partly because that stuff’s private, but mostly because that would generally just be pretty sh*tty of them.
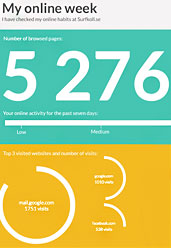
Once your numbers are ready, you’ll see the total number of pages you browsed in the last week with a rating of low to extreme. You’ll get your top three most visited sites, your total visits to each and a line chart tracking your activity.
And finally, a “Surf Selfie” that collects all those stats in one image.
You just accidentally reached Peak Selfie.


